


The math is brutal in its simplicity: if you pay more per hour for the same hours, your labor line eats your margin — unless you find another lever. Most operators can't raise prices fast enough to keep up, and they can't cut headcount without breaking service. So they're doing something harder, and more interesting: they're getting better at scheduling, tracking, and running the shift.
This report pulls together fresh 2026 data from the U.S. Bureau of Labor Statistics1, industry-standard labor-cost benchmarks, and aggregated platform metrics from Teamsly customer accounts2. The teams winning right now aren't spending more on software, they're spending smarter on hours. Here's exactly how.
The headline numbers
Three figures define hourly work in 2026. Memorize them — everything else in this report rolls up to one of these.
YoY growth in average hourly earnings, April 2026
Average monthly admin time clawed back per manager
Average reduction in labor cost from smarter shift coverage
U.S. production and nonsupervisory workers reached $32.23/hr in April 2026 while the workweek stayed flat at 33.8 hours1. Across Teamsly accounts, managers on a single mobile-first platform recovered 21 hours/month from spreadsheets and paper timesheets, and teams that matched scheduled hours to actual demand cut labor as a share of revenue by 12% within 90 days.2
Two of those numbers are pulling in opposite directions, and that's the whole game. Wages are going up. The hours you waste are going down — if you've built the operational muscle to catch them. The next 5 sections break down where that muscle gets built, in order of how much it actually moves the labor line.
The labor cost squeeze, in numbers
Start with the BLS baseline. The April 2026 Employment Situation report puts the U.S. unemployment rate at 4.3% — effectively a tight labor market by historical standards — with 4.9 million workers stuck part-time involuntarily and another 6.1 million who want a job but aren't actively looking.1 Translation: the people you want to hire have options, and the people you have on staff are watching their hours like a hawk.
Layer on the wage data. Average hourly earnings for all private nonfarm employees reached $37.41, with production and nonsupervisory workers at $32.23. The workweek for nonsupervisory staff held flat at 33.8 hours.1 When wages rise and hours don't, your weekly payroll grows even if your headcount and schedule are identical to last quarter.
Labor cost as a % of revenue, by industry
Industry benchmarks tell you whether you're bleeding or just normal. The chart below shows the upper end of the healthy range for each vertical — teams running consistently above the band are typically over-scheduled, under-tracked, or both.
LABOR COST AS A % OF REVENUE, BY INDUSTRY
Upper end of the healthy operating range. Long-running operator benchmarks across U.S. shift-based verticals.
Source: Teamsly Research benchmarks, 20262
We weren't growing our payroll. The market was. We had to either accept a smaller margin every quarter, or finally get serious about how every hour was scheduled. We picked option two.— Maya Thompson, GM, two-location café, Austin TX
Where the hours actually go
Before software, before AI, before any of it — the first question is where your manager's week is going. Across Teamsly customer accounts, the average shift-team manager loses the equivalent of a half-time job every week to tasks that aren't customer-facing.2
THE MANAGER'S WEEK, BEFORE AUTOMATION
Average hours per week, per shift-team manager, on each admin task.
the schedule
reconciliation
& call-outs
& audits
/ chasing
onboarding
Source: Teamsly aggregated customer data, 20262
That's roughly 22.7 hours a week, or a little over 90 hours a month, vanishing into the admin tax. The 21-hour-per-month savings we cited at the top of this report — that's just the scheduling-and-compliance slice clawed back. Teams that automate the rest typically claw back closer to 40 hours a month in total.
90hrs
Average monthly admin load on a shift-team manager before automation — more than two full work weeks per month, per manager.2
The teams beating the squeeze
Here's the part that matters. We looked at Teamsly customer accounts in the top quartile by year-over-year margin improvement, then asked what they were doing differently. Six behaviors showed up over and over, regardless of industry. The chart below shows the average labor-cost-percentage delta — before vs. after — from each one.2
WHAT ACTUALLY MOVED THE LABOR LINE
Average percentage-point reduction in labor cost as % of revenue, 90 days after adopting each behavior. Top-quartile Teamsly accounts.
Source: Teamsly Research, top-quartile customer cohort2
Notice the spread. AI auto-scheduling alone is worth more than a four-percentage-point cut in labor as a share of revenue — because it solves the single most expensive mistake in shift work: assigning more hours than the day actually needs. Geofenced clock-in is close behind, because it eliminates the silent tax of early punches and buddy-punching, which compound across a payroll period.
The cumulative effect of stacking three or more of these behaviors is what gets you to that headline −12% labor-cost reduction. None of them, on their own, is dramatic. Together, they're the difference between a margin-positive year and another flat one.
Admin hours saved per pay period, by team size
The savings scale with team size in a non-linear way. The bigger your team, the more the admin tax compounds — and the bigger the win when you flip it off.
ADMIN HOURS SAVED PER PAY PERIOD
Average across Teamsly accounts that adopted AI scheduling + geofenced clock-in within a 60-day window.
Source: Teamsly aggregated customer data, 20262
The day we turned on geofencing, our weekly labor variance dropped 9% — in a single pay period. We didn't fire anyone, we didn't change schedules, we didn't even tell the team it was on yet. Buddy-punching just stopped.— Devon Park, Owner, Pacific Northwest HVAC crew
Mobile, bilingual, geo-aware
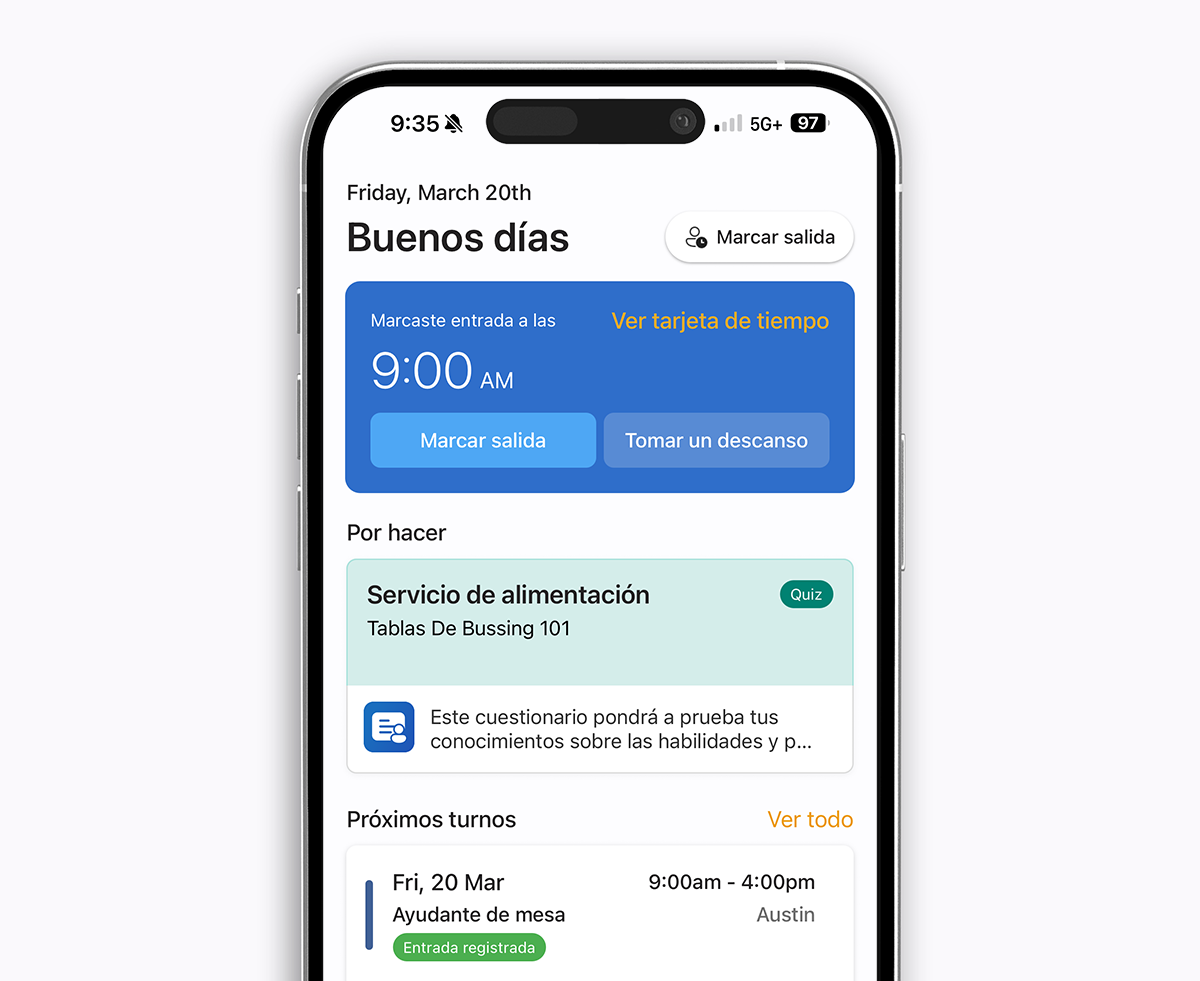
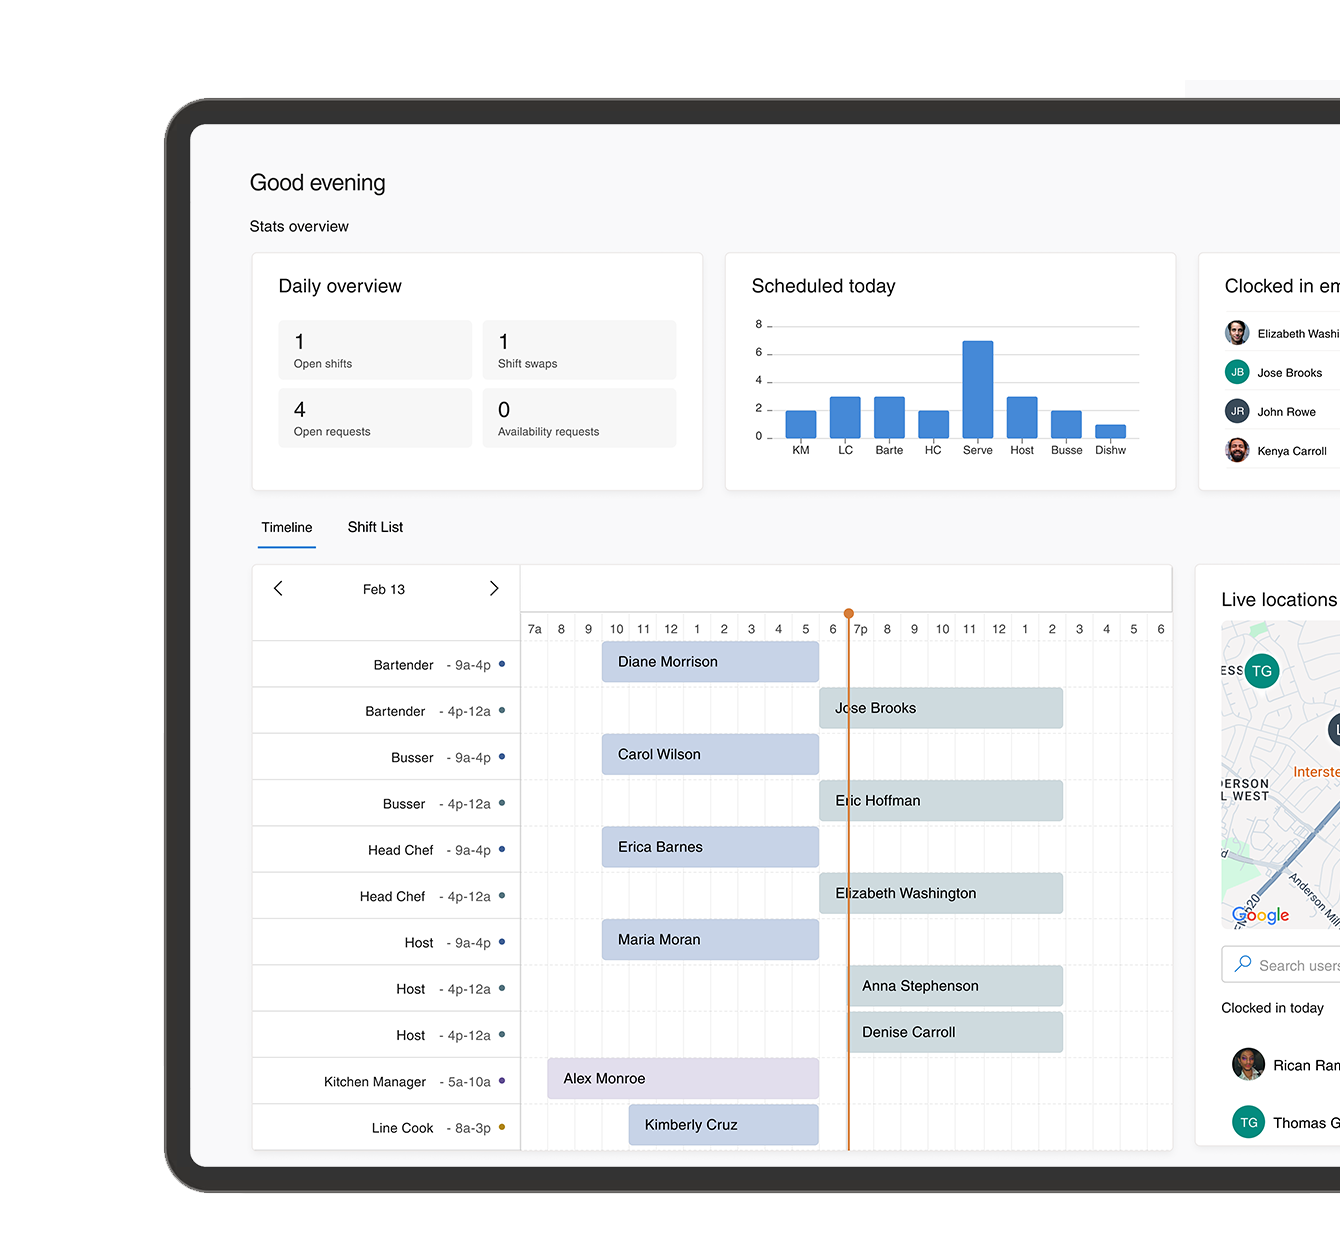
The biggest shift inside shift work isn't in any single feature — it's in the surface. In 2026, the schedule lives in your team's pocket, not on a printout taped to the back-of-house wall. Three things have become non-negotiable, and the teams that ignore them are the ones still chasing call-outs at 6am.
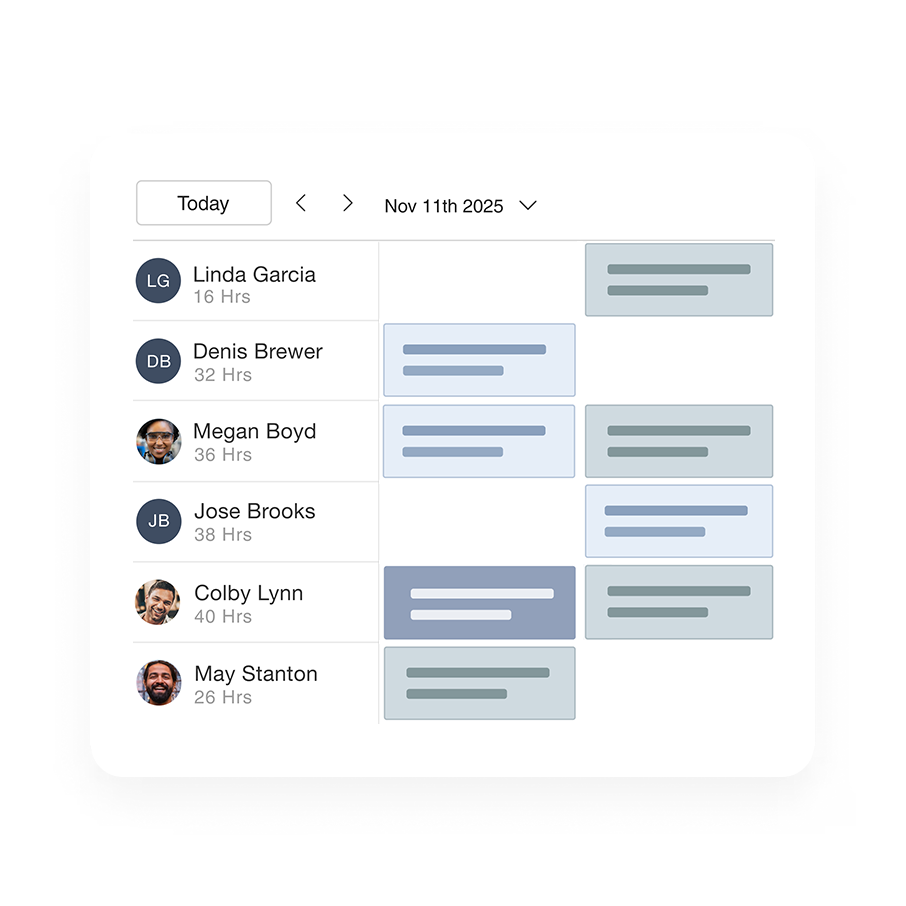
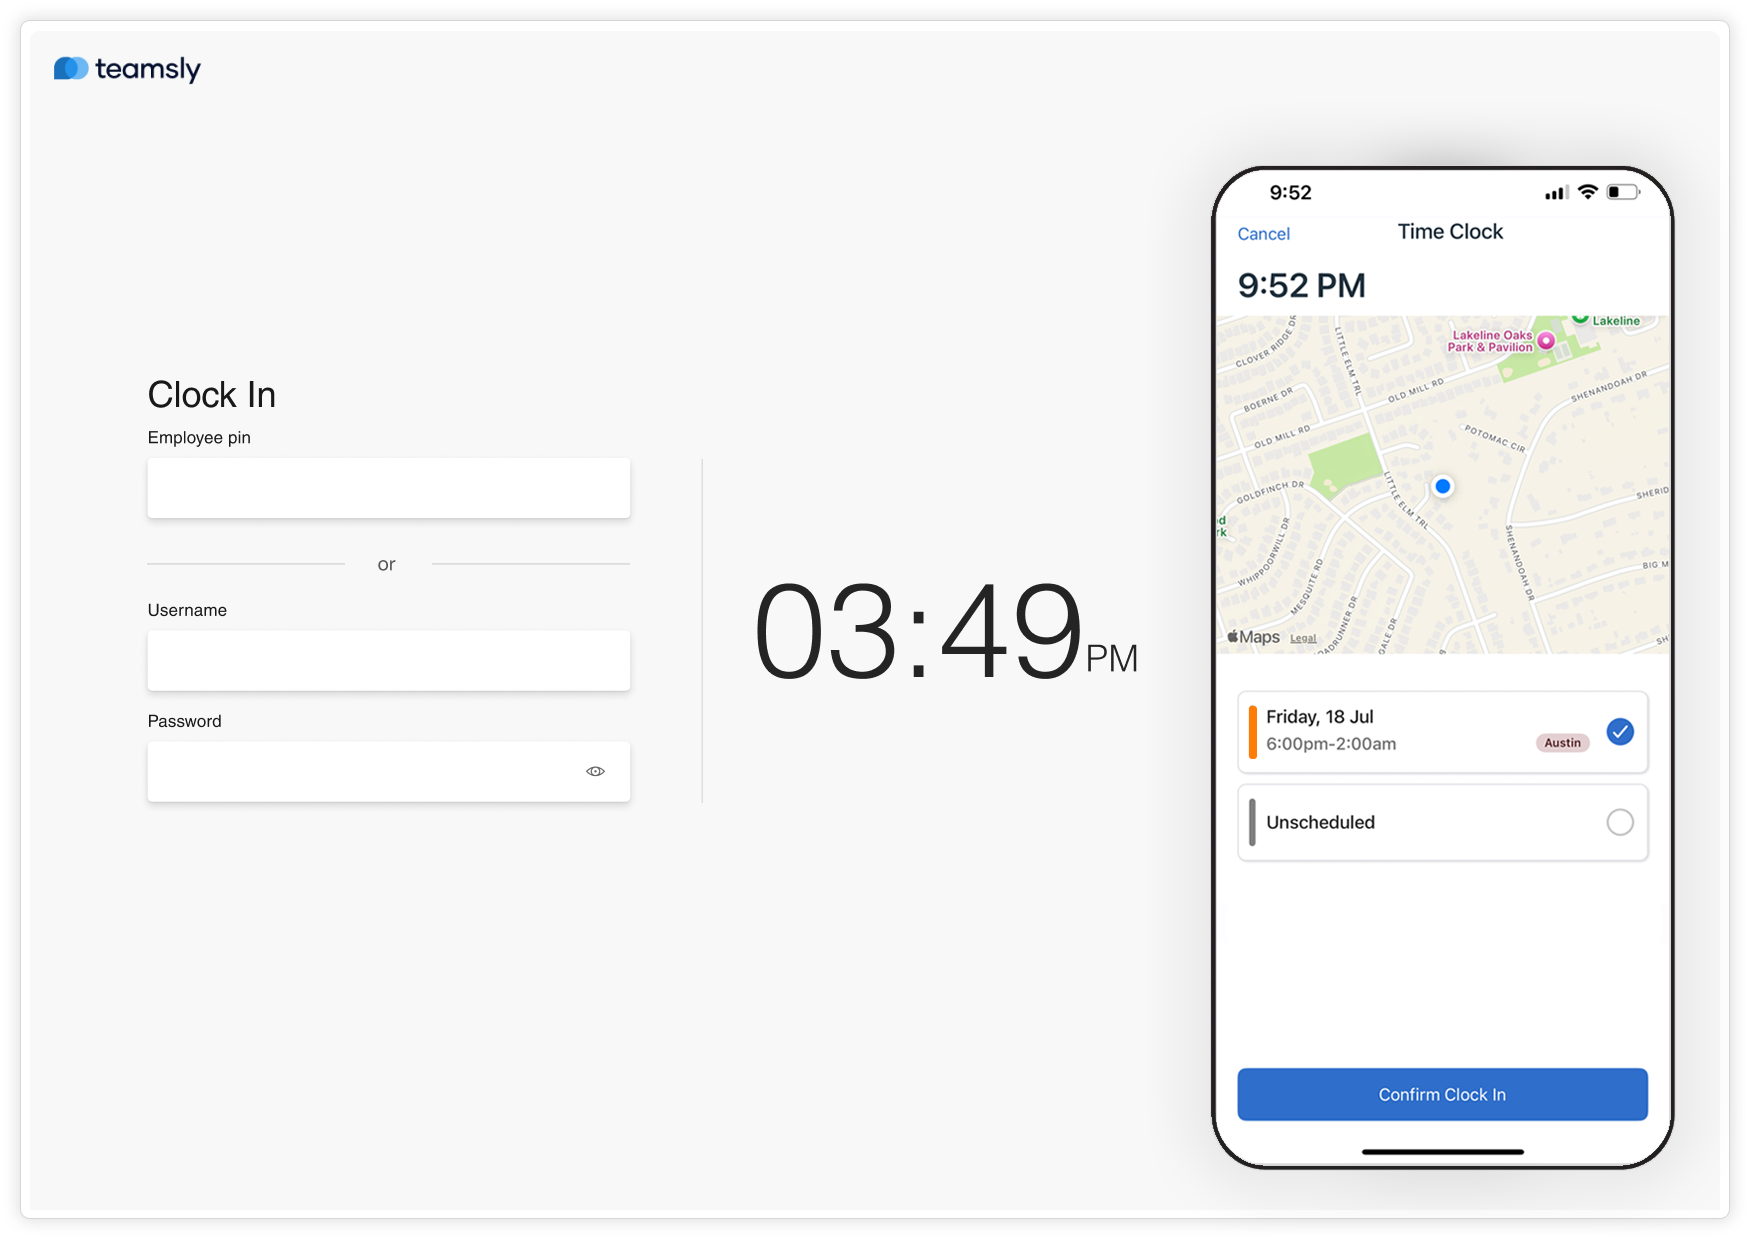
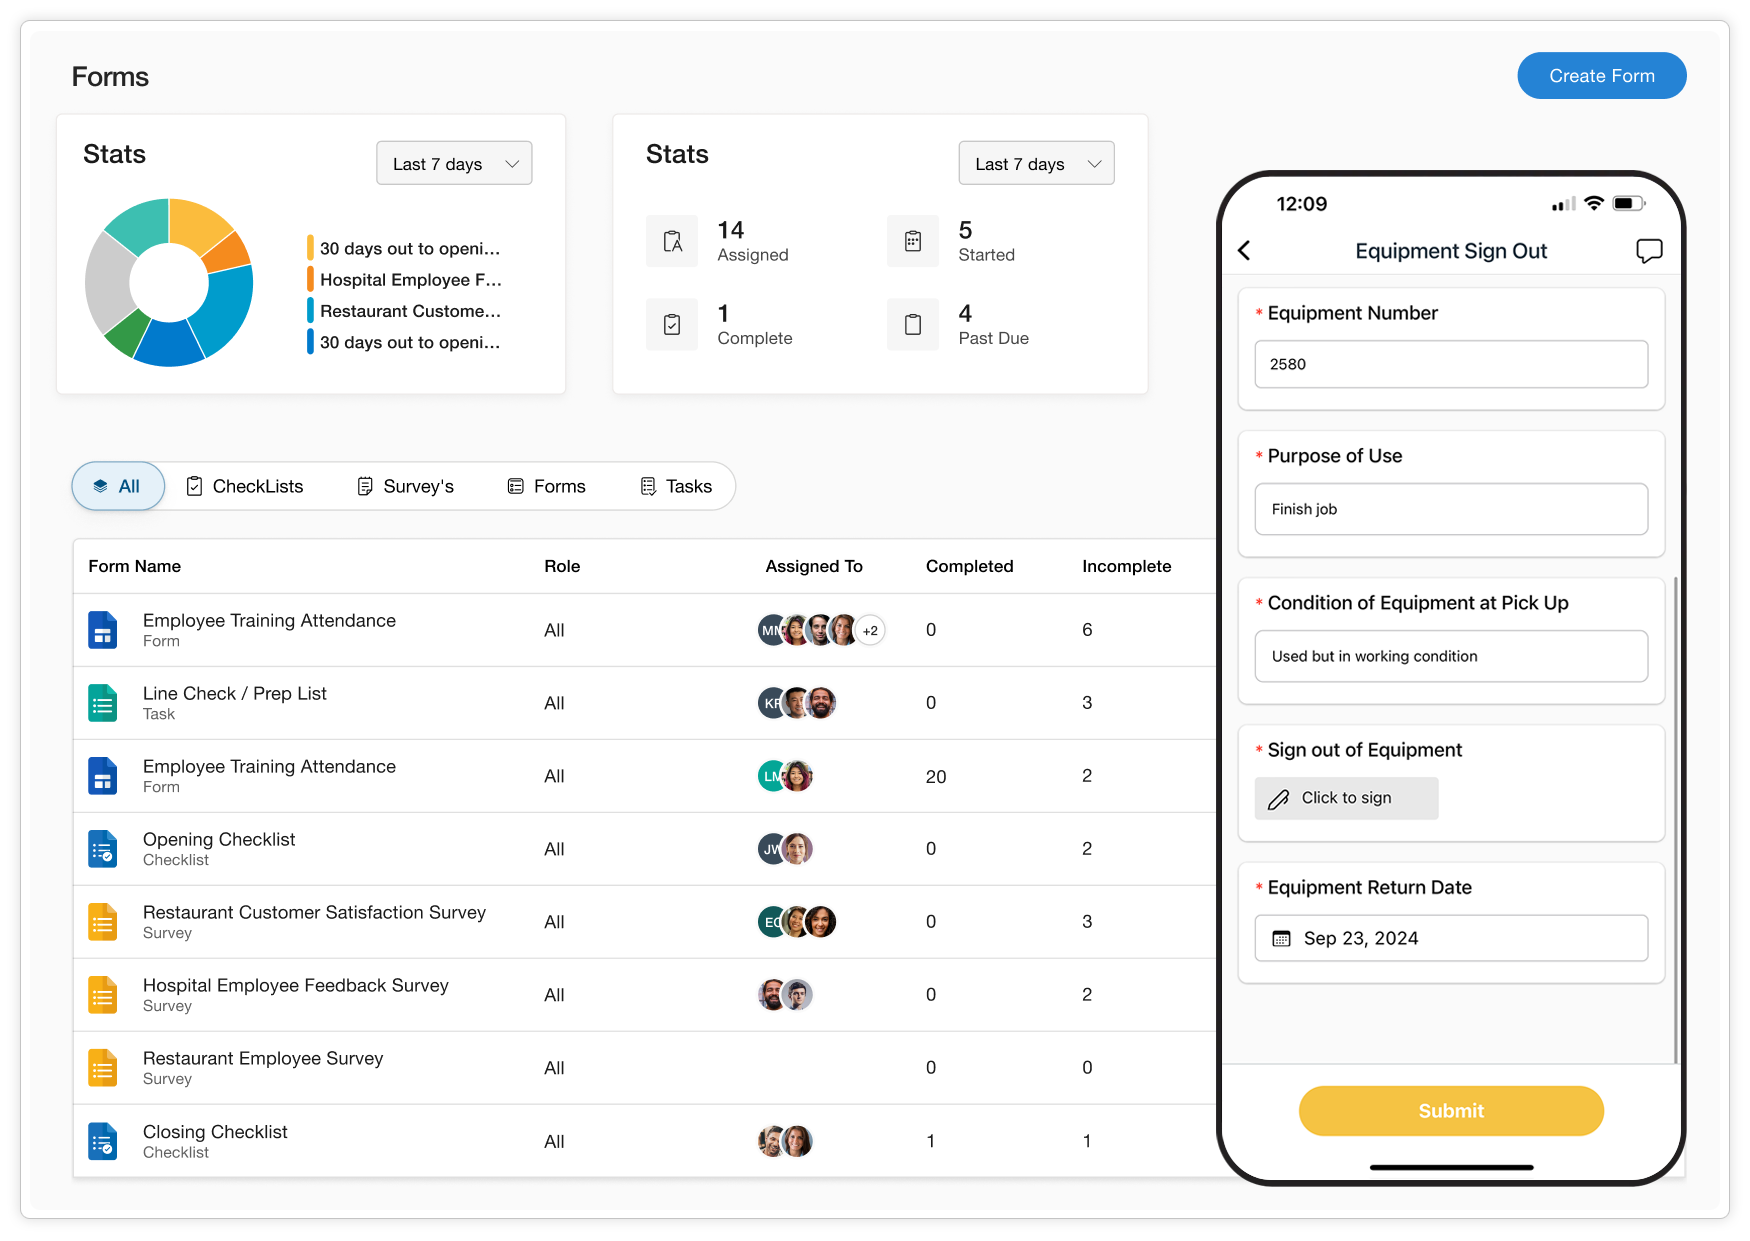
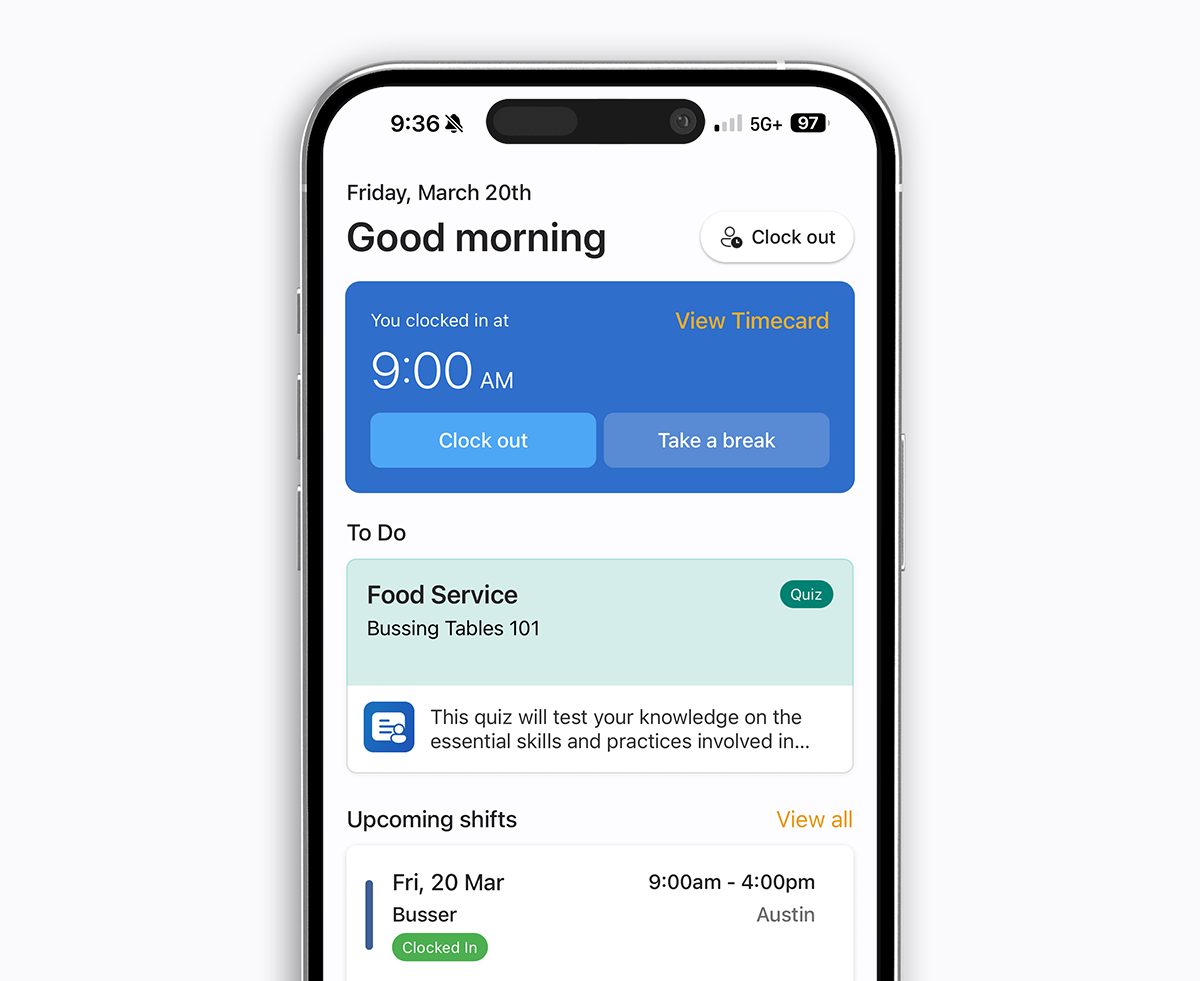
Mobile-first. The schedule, the clock, the chat, the form, the training quiz — all on the same phone the employee already carries. Bilingual. A meaningful share of the shift-based workforce in food service, healthcare, hospitality, construction, and cleaning is Spanish-speaking; one-tap EN/ES switching is now table stakes, not a nice-to-have. Geo-aware. Geofenced clock-in, breadcrumb GPS for field crews, and location-tagged forms turn the "where" into an audit trail without anyone having to think about it.
The 2026 playbook
If you read nothing else, read this. Seven plays, in the order we'd run them. Each one is a behavior, not a tool — the tool is whatever lets you ship the behavior reliably.
- Publish the schedule 14 days out. Every day of lead time you give your team buys you fewer call-outs and fewer last-minute coverage scrambles. Two weeks is the sweet spot for most industries.
- Turn on geofenced clock-in. The single fastest labor-cost win in this report. Soft-fence (flag for review) is enough for most teams; hard-fence (block punches outside the radius) for compliance-heavy verticals.
- Wire predictive overtime alerts. The alert has to fire before the punch that crosses 40, not after. Send the push to both the employee and the manager.
- Match coverage to demand, not to last week. Pull a rolling 8-week sales or visit pattern and let it drive your shift template. AI auto-scheduling does this in seconds; manual works too, it just takes Sundays.
- Move every form, audit, and checklist into the app. Pre-shift safety, opening & closing, food-temp logs, vehicle checks — whatever your version is. Paper costs you a manager hour per location per week, conservatively.
- Ship the app bilingually from day one. Don't bolt EN/ES on later. The team adopts the app on day one or never; if half your staff can't read the schedule, they won't trust it.
- Run a weekly labor-variance review. Fifteen minutes, every Monday: scheduled hours vs. clocked hours vs. demand. The teams that do this catch over-scheduling drift before it eats a month of margin.
What to do this quarter
You don't have to do all seven at once. The accounts in our top-quartile sample averaged just 3.4 of the above behaviors live at any given time — they just picked the right three for their stage. If you're under 20 employees, start with plays 1, 2, and 5. If you're 20–100, add plays 3, 4, and 7. If you're 100+, all seven, and you'll need play 6 to onboard fast enough to keep up.
And test before you roll out. Pick one location, one team, one pay period. Run the new behavior side-by-side with your current process for two weeks, then compare scheduled vs. clocked hours, OT incurred, and time-to-publish. If the numbers move — and they will — roll it out everywhere. If they don't, you've learned something about your operation in 14 days that you'd otherwise take a year to discover.
The labor cost squeeze isn't going anywhere in 2026. The good news is that the tools to beat it are already in your team's pocket. You just have to turn them on.
- U.S. Bureau of Labor Statistics, The Employment Situation — April 2026, release USDL-26-0687, May 8, 2026. bls.gov/news.release/empsit.nr0.htm
- Teamsly aggregated, anonymized platform metrics across active customer accounts, Jan–Apr 2026. Industry labor-cost % bands reflect long-running operator benchmarks and are presented as planning ranges, not audited results.